How much does your team deliver per sprint?
A velocity chart for your Jira dashboard. Pick a project or a saved filter: the gadget shows what was planned and what was done in each sprint, and gives the average velocity and the trend in one sentence.
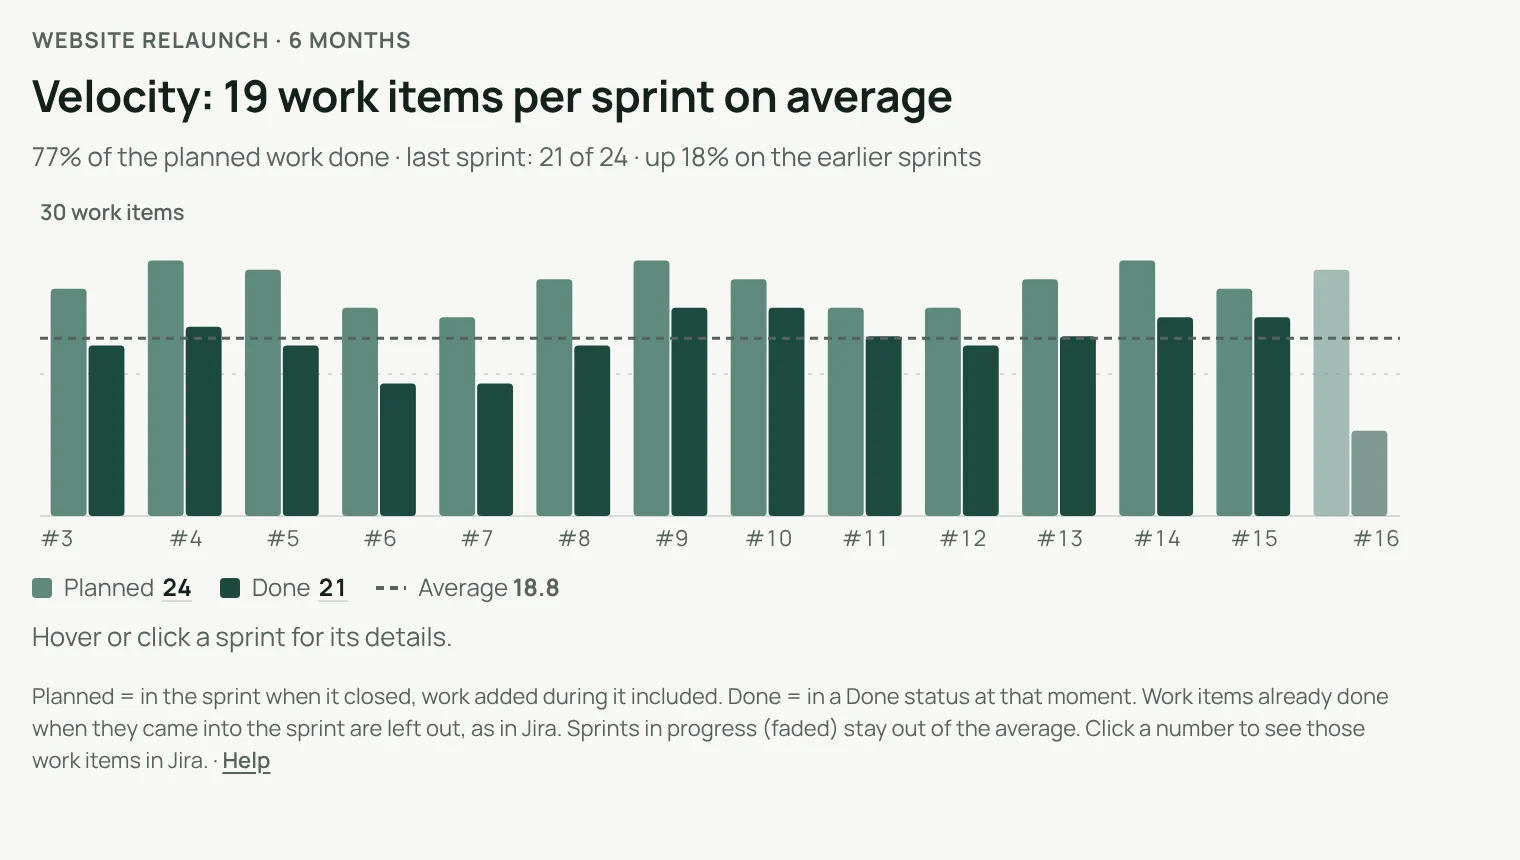
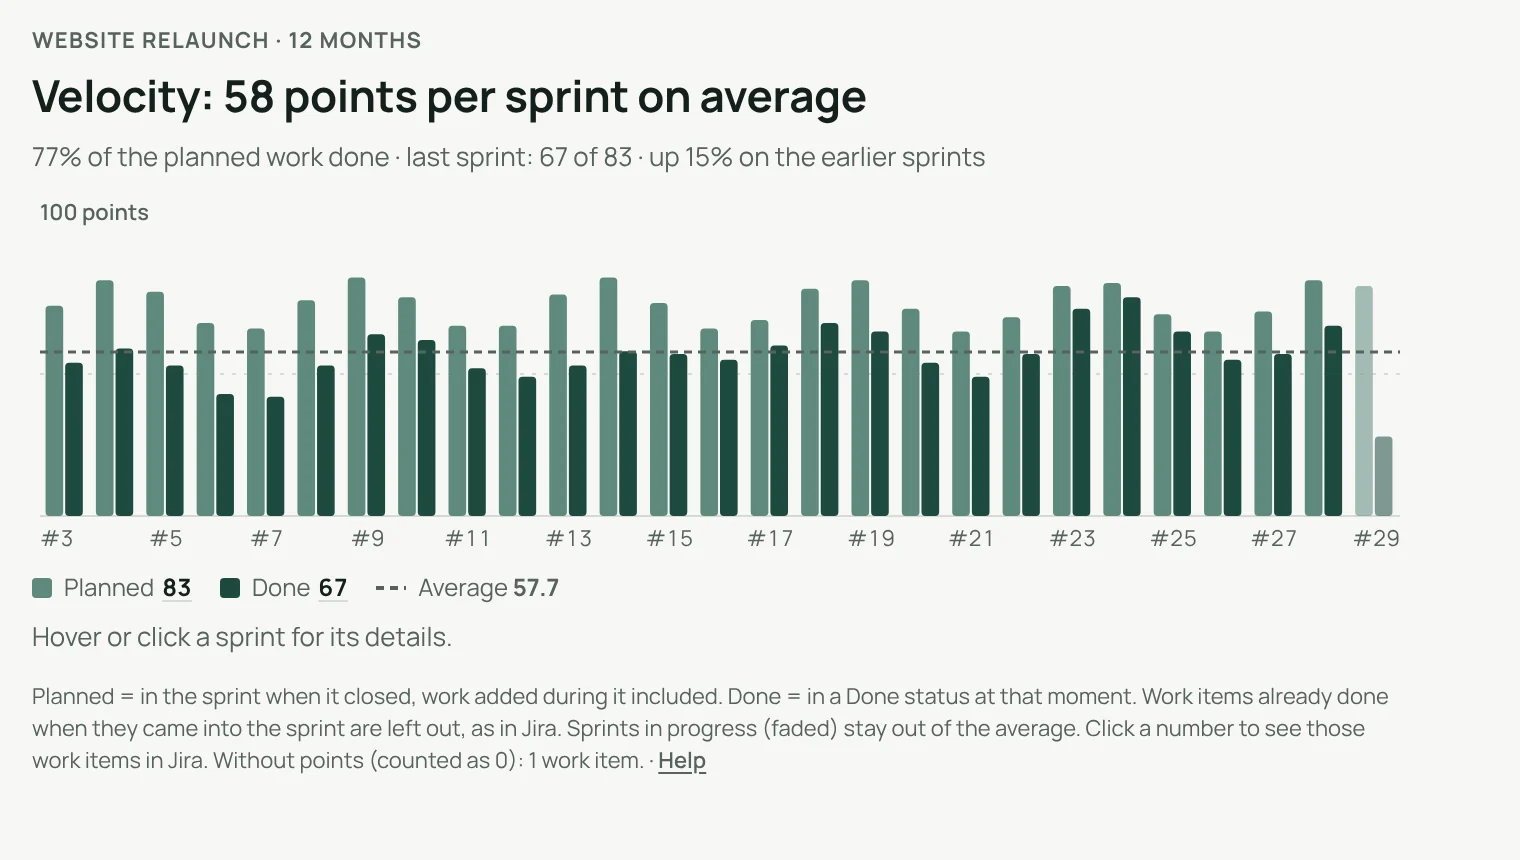
Work items or story points.
Count work items or story points, with sub-tasks if you want them, over 3, 6 or 12 months. The sprint in progress is shown faded and stays out of the average, so it never looks like a drop.
- Planned means in the sprint when it closed, work added during it included
- Work already done when it came into a sprint is left out, as in Jira
Every number can be checked.
Click a sprint
See what was planned and what was done.
Open them in Jira
Planned or done: the exact work items, with the same search.
Done means done
In a Done status when the sprint closed.
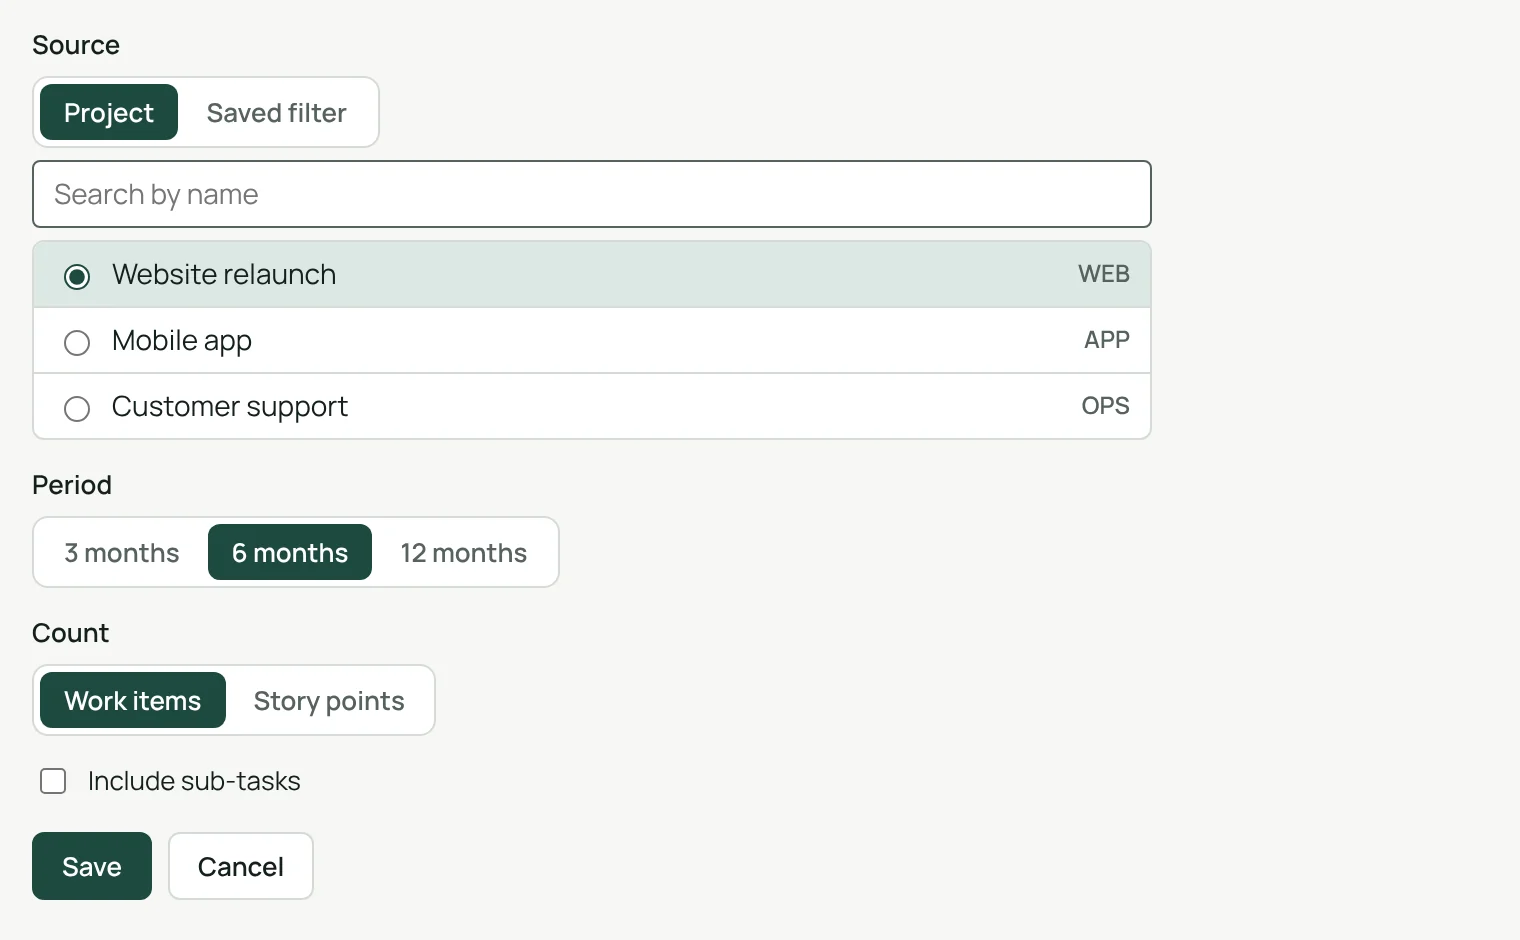
Set up in one screen.
A project or a saved filter, a period, work items or story points, sub-tasks if you want them. That is all.
- Each person sees only the projects and filters they can open
- Settings are kept by Jira, with the gadget
Plan the next sprint on what you really deliver.
Velocity shows how much your team finishes, sprint after sprint, so the next sprint is planned on facts rather than hopes.
Light and dark
Follows Jira’s theme.
English, French, German
Follows each person’s Jira language.
A one-hour cache
To spare Jira, the counts it has just shown are kept one hour at most.
Runs on Atlassian
Nothing leaves your Atlassian site.
Three steps.
- Add the gadgetto any Jira dashboard.
- Pick a source and a perioda project or a saved filter, over 3, 6 or 12 months.
- Read the answerthe average velocity and the trend, in one sentence.
Permissions and data
The gadget reads Jira with the permissions of the person viewing the dashboard: nobody sees a project or filter they cannot open. Its settings are kept by Jira with the gadget. To spare Jira, it keeps the sprint data it has just read for one hour at most, in Atlassian’s storage for your site: the project or filter name, sprint names and dates, work item IDs, statuses and story points, with no account ID and no work item content. Nothing is sent outside your Atlassian site.
Questions, answered.
- Where do I find it?
- Edit a Jira dashboard, choose Add gadget and pick Velocity.
- What counts as planned?
- Everything in the sprint when it closed, work added during the sprint included.
- Why is the sprint in progress left out of the average?
- It is not finished. Counting it would make every new sprint look like a drop.
- Jira already has a velocity report. Why this one?
- Jira’s report belongs to a board. Clearlane Velocity goes on any dashboard, reads a project or a saved filter, gives the average and the trend in one sentence, and every number opens its work items in Jira.
- Does it work in French and German?
- Yes. The gadget follows each person’s Jira language, in English, French or German, in light and dark themes.
Clearlane dashboard gadgets
Five charts for any Jira dashboard, each with its answer in one sentence. Every number opens its work items in Jira.
All Clearlane dashboard gadgetsFree for up to 10 users.
Larger teams pay per user, billed by Atlassian on the Marketplace. No setup, nothing to install outside your Atlassian site.