Jira dashboard gadgets that answer in one sentence.
Three charts for any Jira dashboard. Each one asks a single question about your project, answers it in plain words above the chart, and opens the exact work items behind every number.
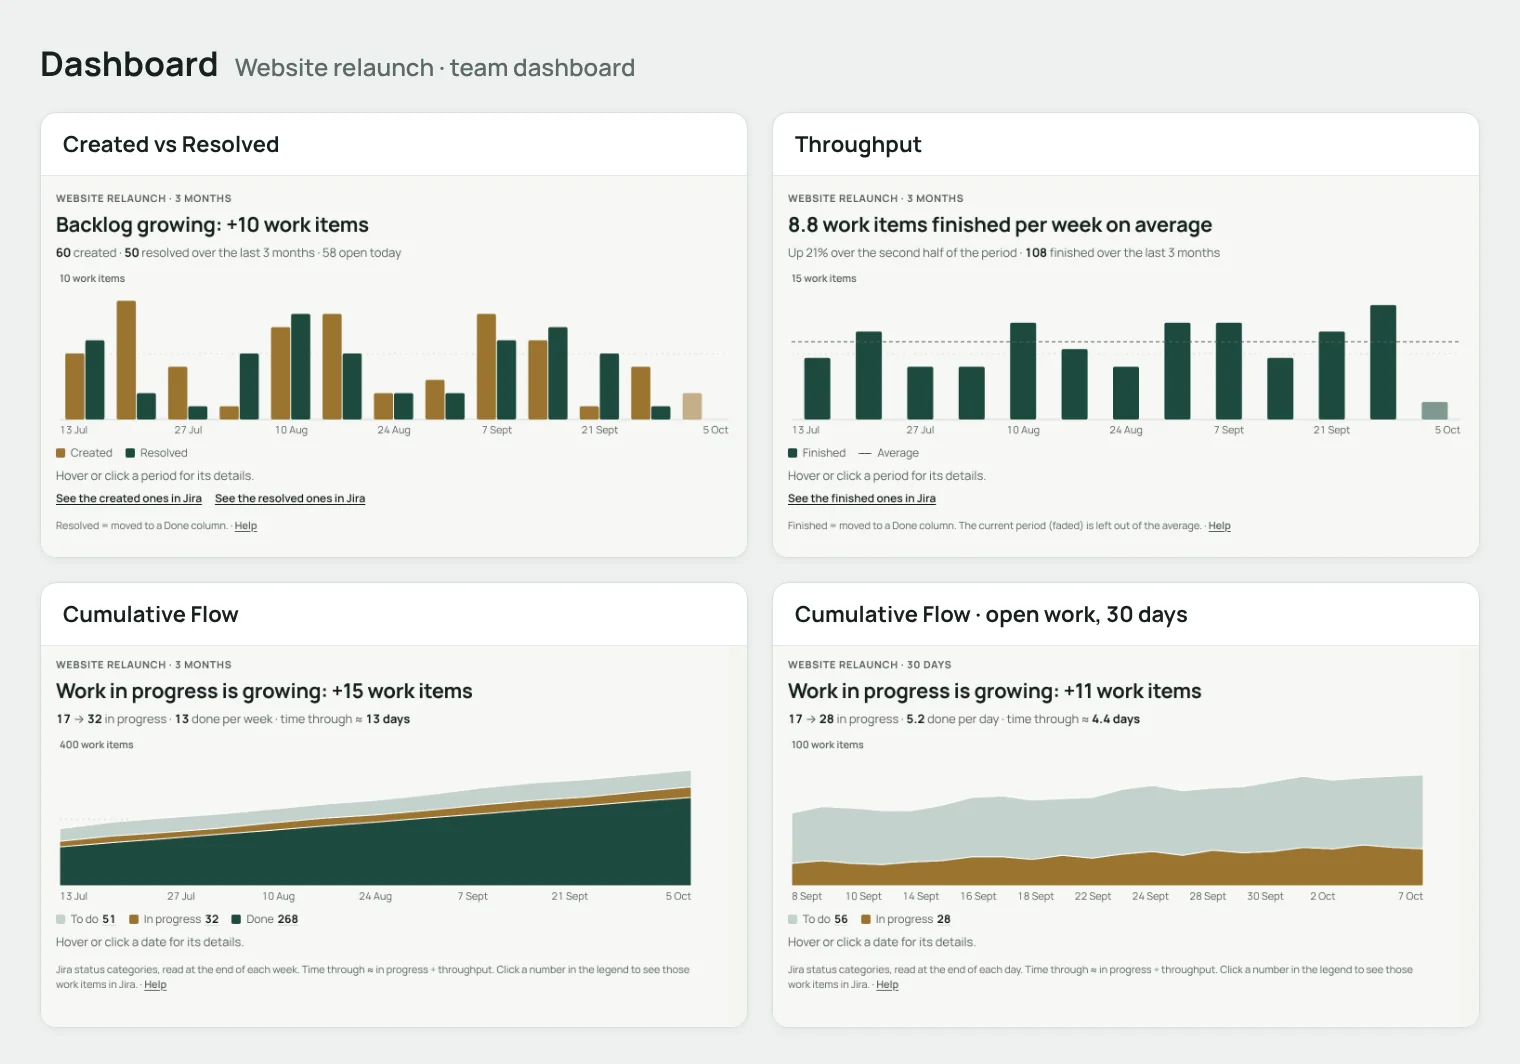
One question per gadget.
Install only the ones you need: each gadget is its own app on the Atlassian Marketplace.
Jira dashboard
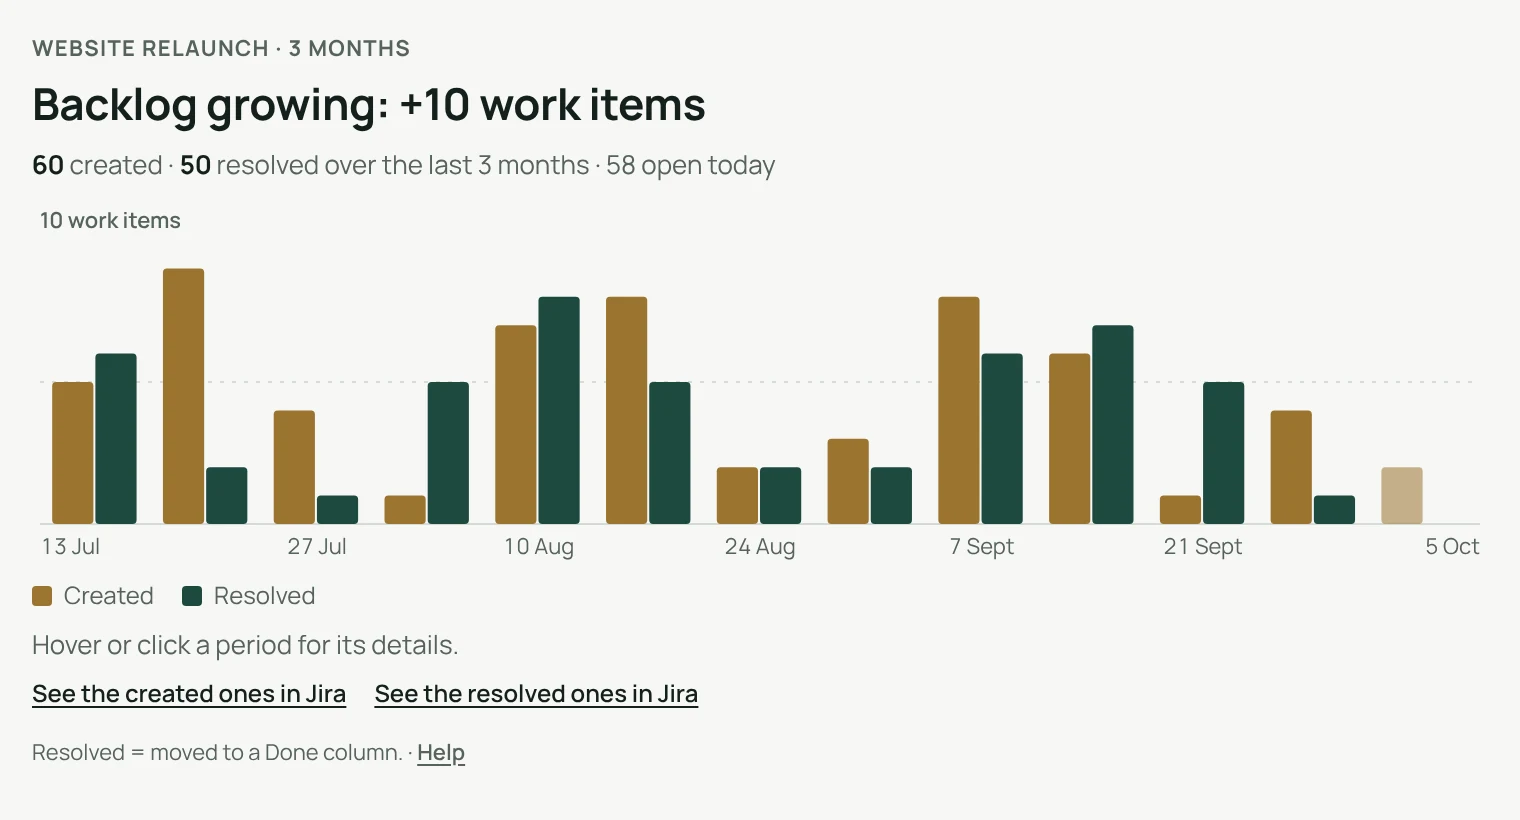
Is the backlog growing or shrinking?
Created and resolved work items per day, week or month, or as running totals with the gap between them.
Learn more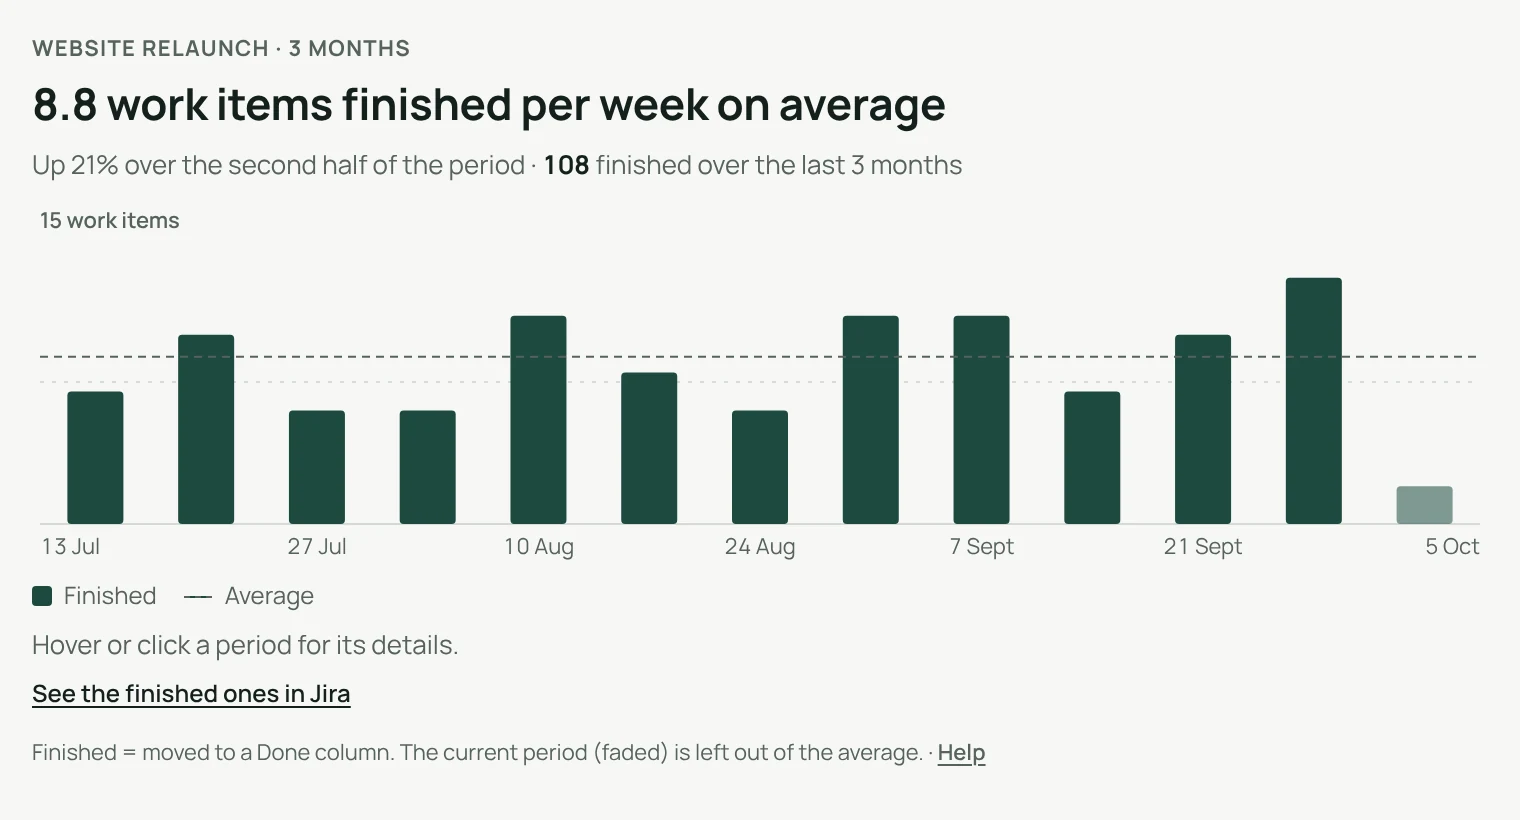
Jira dashboard
How much does the team finish?
Work finished per day, week or month, the average and the trend, for Kanban and Scrum teams.
Learn more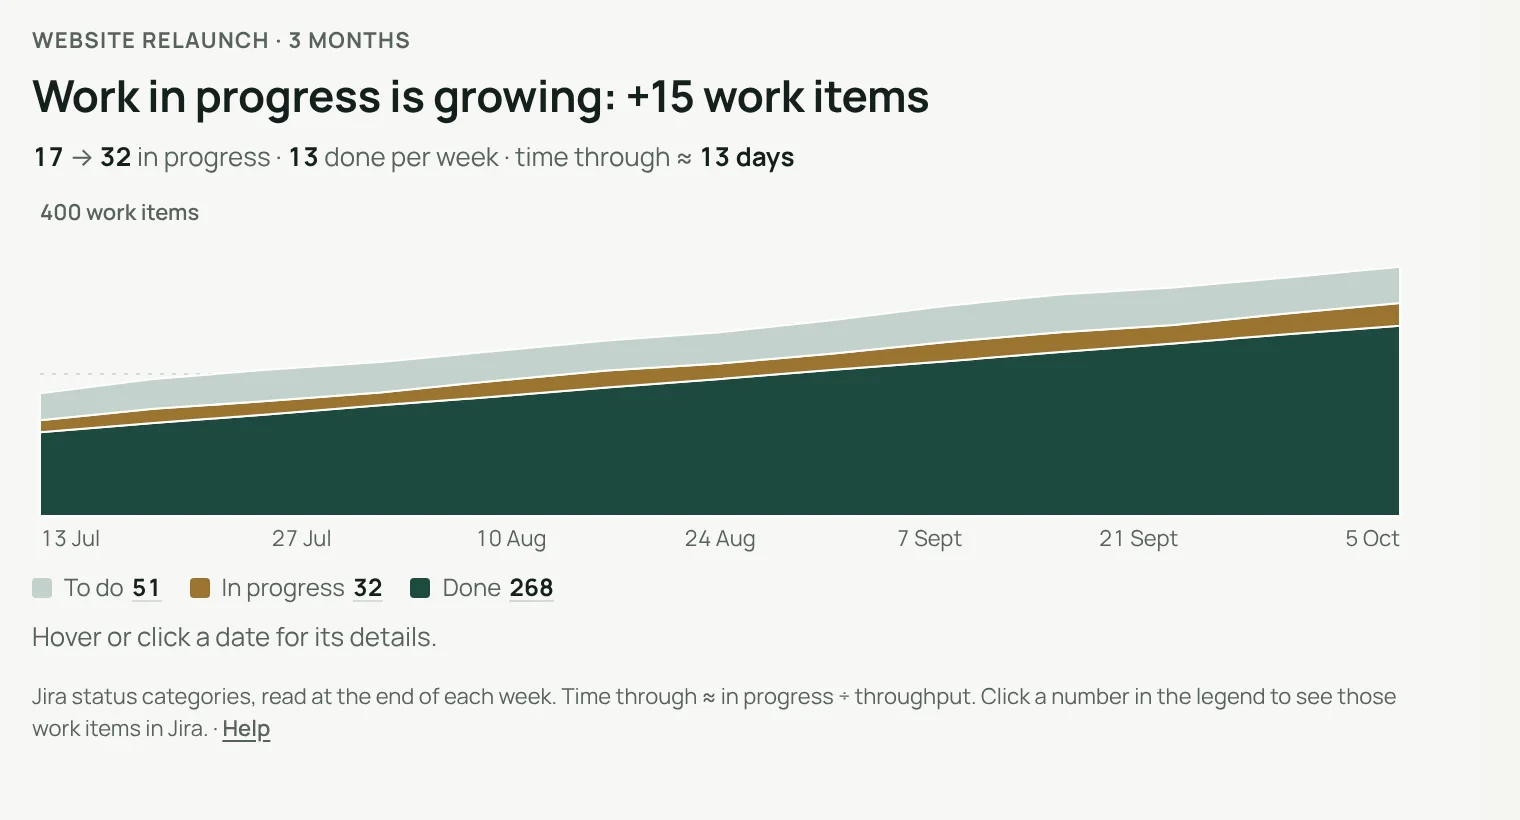
Jira dashboard
Is work piling up in progress?
To do, in progress and done over time, with the pace and the time work takes from start to done.
Learn moreWhich gadget answers which question.
| Question | What the gadget shows | Gadget |
|---|---|---|
| Is the backlog growing or shrinking? | Created vs resolved per period, or two running totals with the gap shaded. | Created vs Resolved |
| Are we closing work faster than it arrives? | The verdict in one sentence: “Backlog growing: +10 work items”. | Created vs Resolved |
| How much do we finish each week? | Work items or story points finished per period, with the average line. | Throughput |
| Is our pace going up or down? | The trend over the second half of the period, in plain words. | Throughput |
| Is work piling up in progress? | Stacked bands of to do, in progress and done over time. | Cumulative Flow |
| How long does work take from start to done? | Time through: work in progress divided by throughput, in days. | Cumulative Flow |
Read the answer, then check it.
The same settings, the same rules and the same look on every gadget, so a dashboard reads at a glance.
A project or a saved filter
Each person sees only what they can open.
Work items or story points
Over 30 days, 3, 6 or 12 months.
Every number opens in Jira
Click a period or a date, then open its work items.
Light and dark
Follows Jira’s theme and each person’s language.
Three steps.
- Install the gadgetfrom the Atlassian Marketplace.
- Add it to a dashboardedit a Jira dashboard, choose Add gadget.
- Pick a source and a periodand read the answer in one sentence.
Permissions and data
The gadgets read Jira with the permissions of the person viewing the dashboard. Their settings are kept by Jira with the gadget. Created vs Resolved and Throughput store nothing else. To spare Jira, Cumulative Flow keeps the counts per status it has just shown for one hour at most, in Atlassian’s storage for your site, with no account ID and no work item content. Nothing is sent outside your Atlassian site.
Questions, answered.
- What is a Jira dashboard gadget?
- A small chart or report you place on a Jira dashboard, next to others, so a team or a manager sees the state of a project on one page.
- How do I add a gadget to a Jira dashboard?
- Install the gadget from the Atlassian Marketplace, open a dashboard, choose Edit, then Add gadget, and pick it from the list.
- Do I need all three?
- No. Each gadget is a separate app, free for up to 10 users. Install the ones that answer your questions.
- Do they suit Kanban and Scrum teams?
- Yes. They count what reaches each status category, whatever the board, the method or the sprint length.
- Jira already has a created vs resolved chart. Why this one?
- Clearlane Created vs Resolved gives the answer in one sentence, counts work items or story points, shows running totals with the gap, and every number opens its work items in Jira.
- Where is the data kept?
- In your Atlassian site. The gadgets read Jira as the person viewing the dashboard; nothing is sent to our servers.
Free for up to 10 users.
Each gadget is free for up to 10 users. Larger teams pay per user, billed by Atlassian on the Marketplace.