How long does work really take?
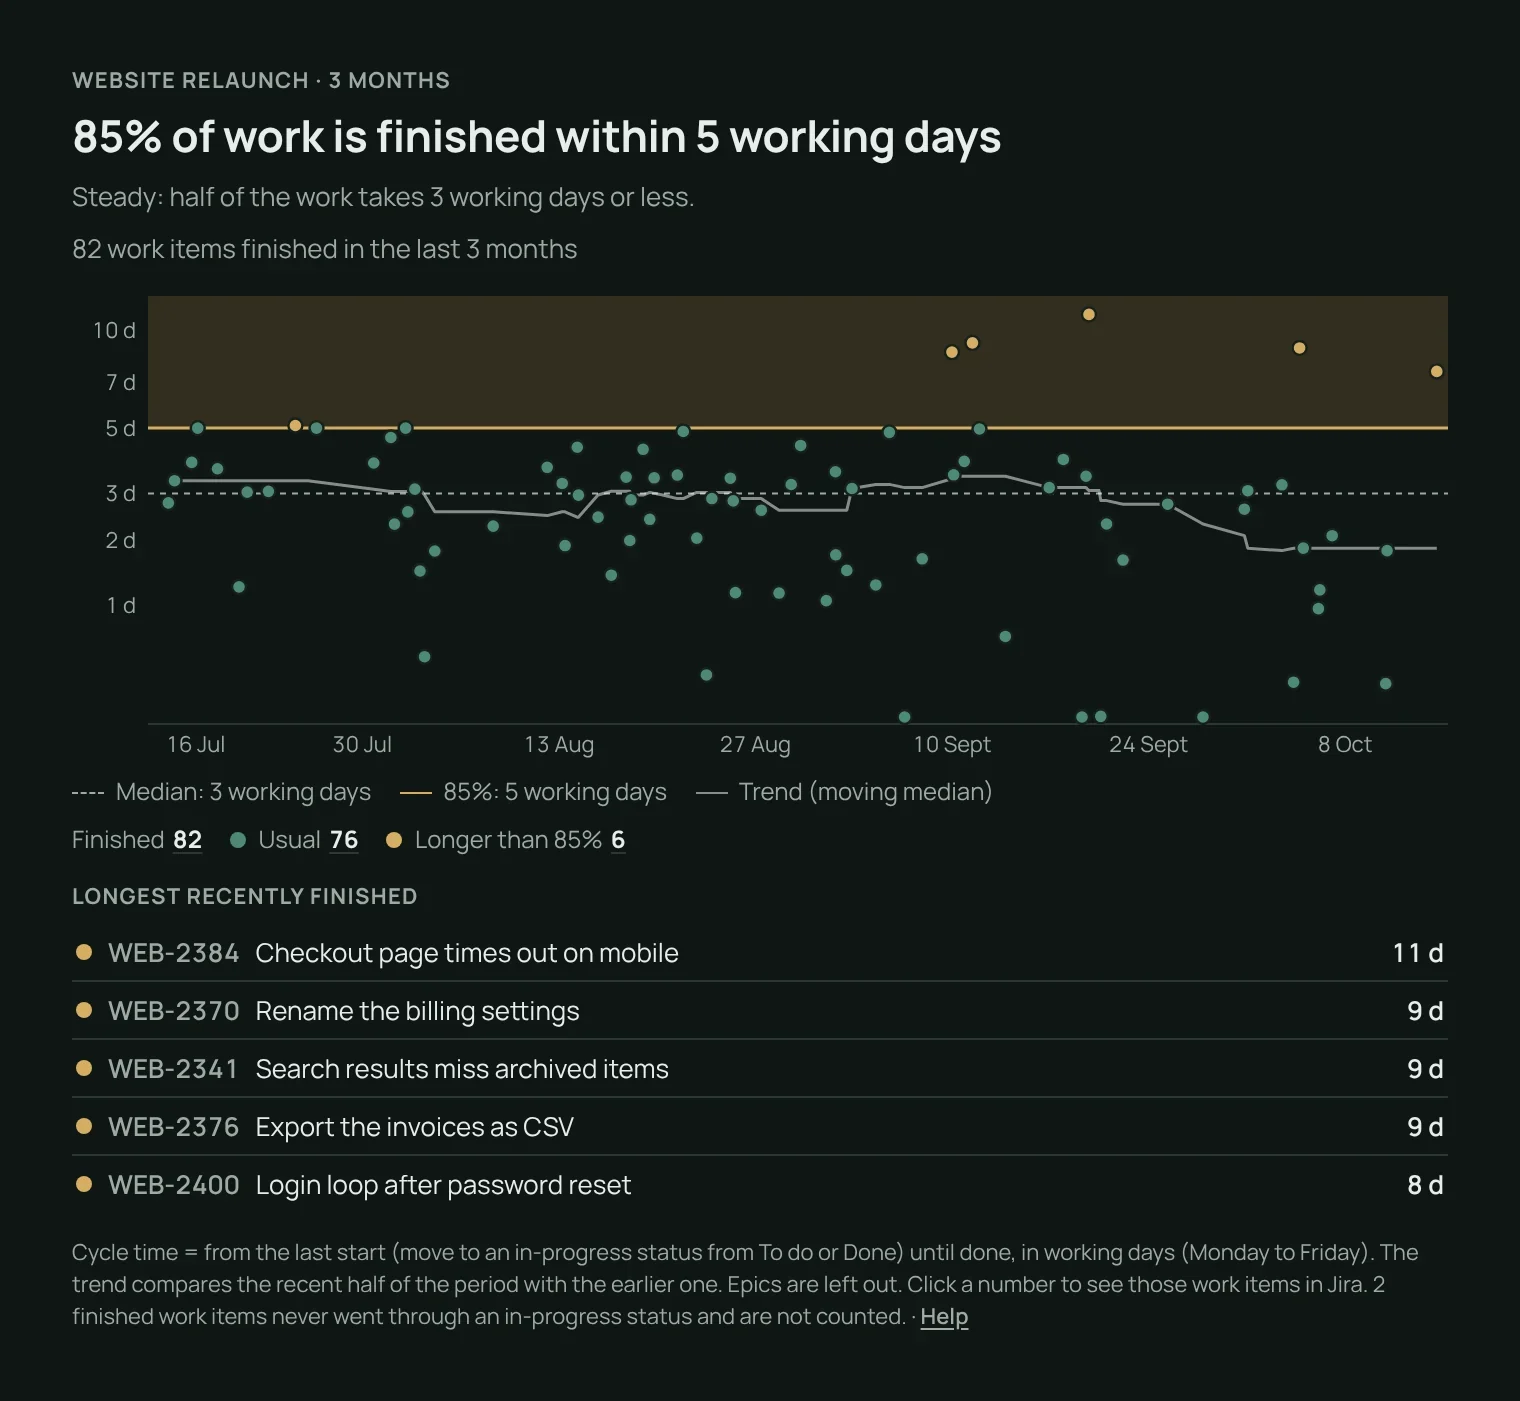
A cycle time control chart for your Jira dashboard. Pick a project or a saved filter and a period: every finished work item is a dot, placed by its finish date and the time it took from start to done, with the median, the 85% line and the trend in one sentence.
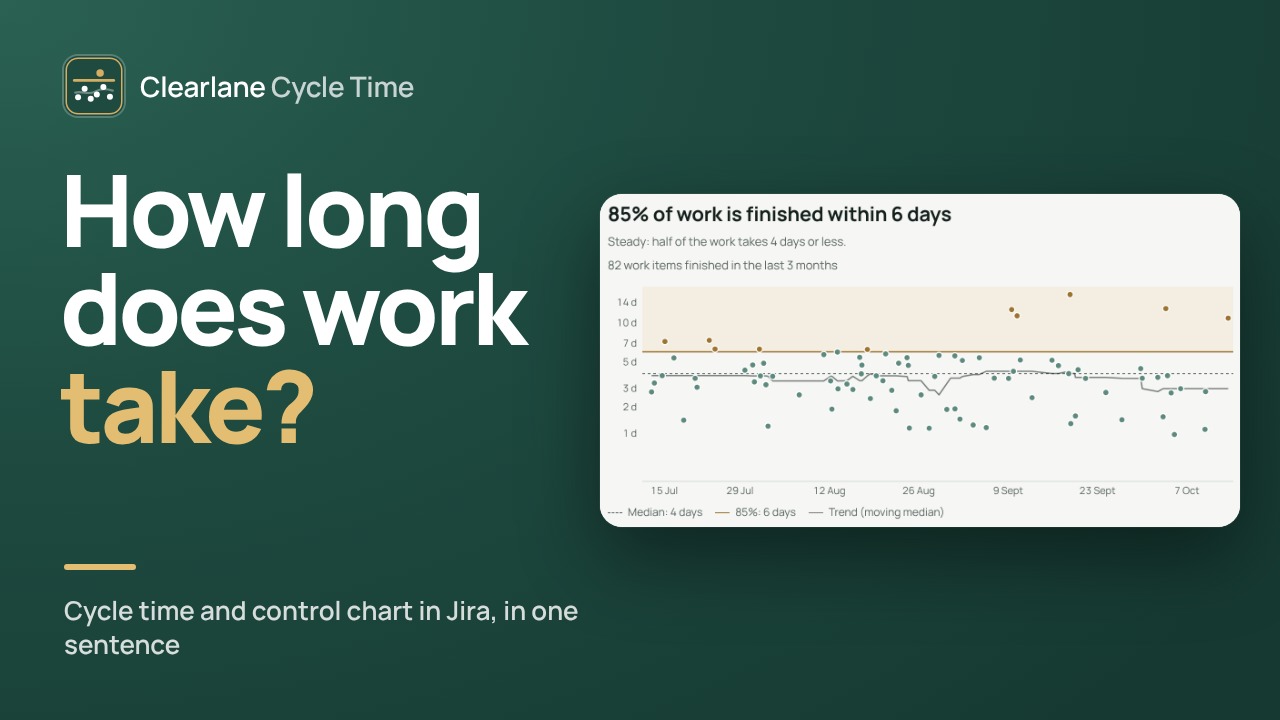
The usual range, in two lines.
The median and the 85% line give the usual range of your cycle time, and a moving median shows the trend. The work items that took longest recently are named under the chart.
- Cycle time runs from the last start (from To do or Done) until done
- Finished work that never went through an in-progress status is counted apart and not drawn
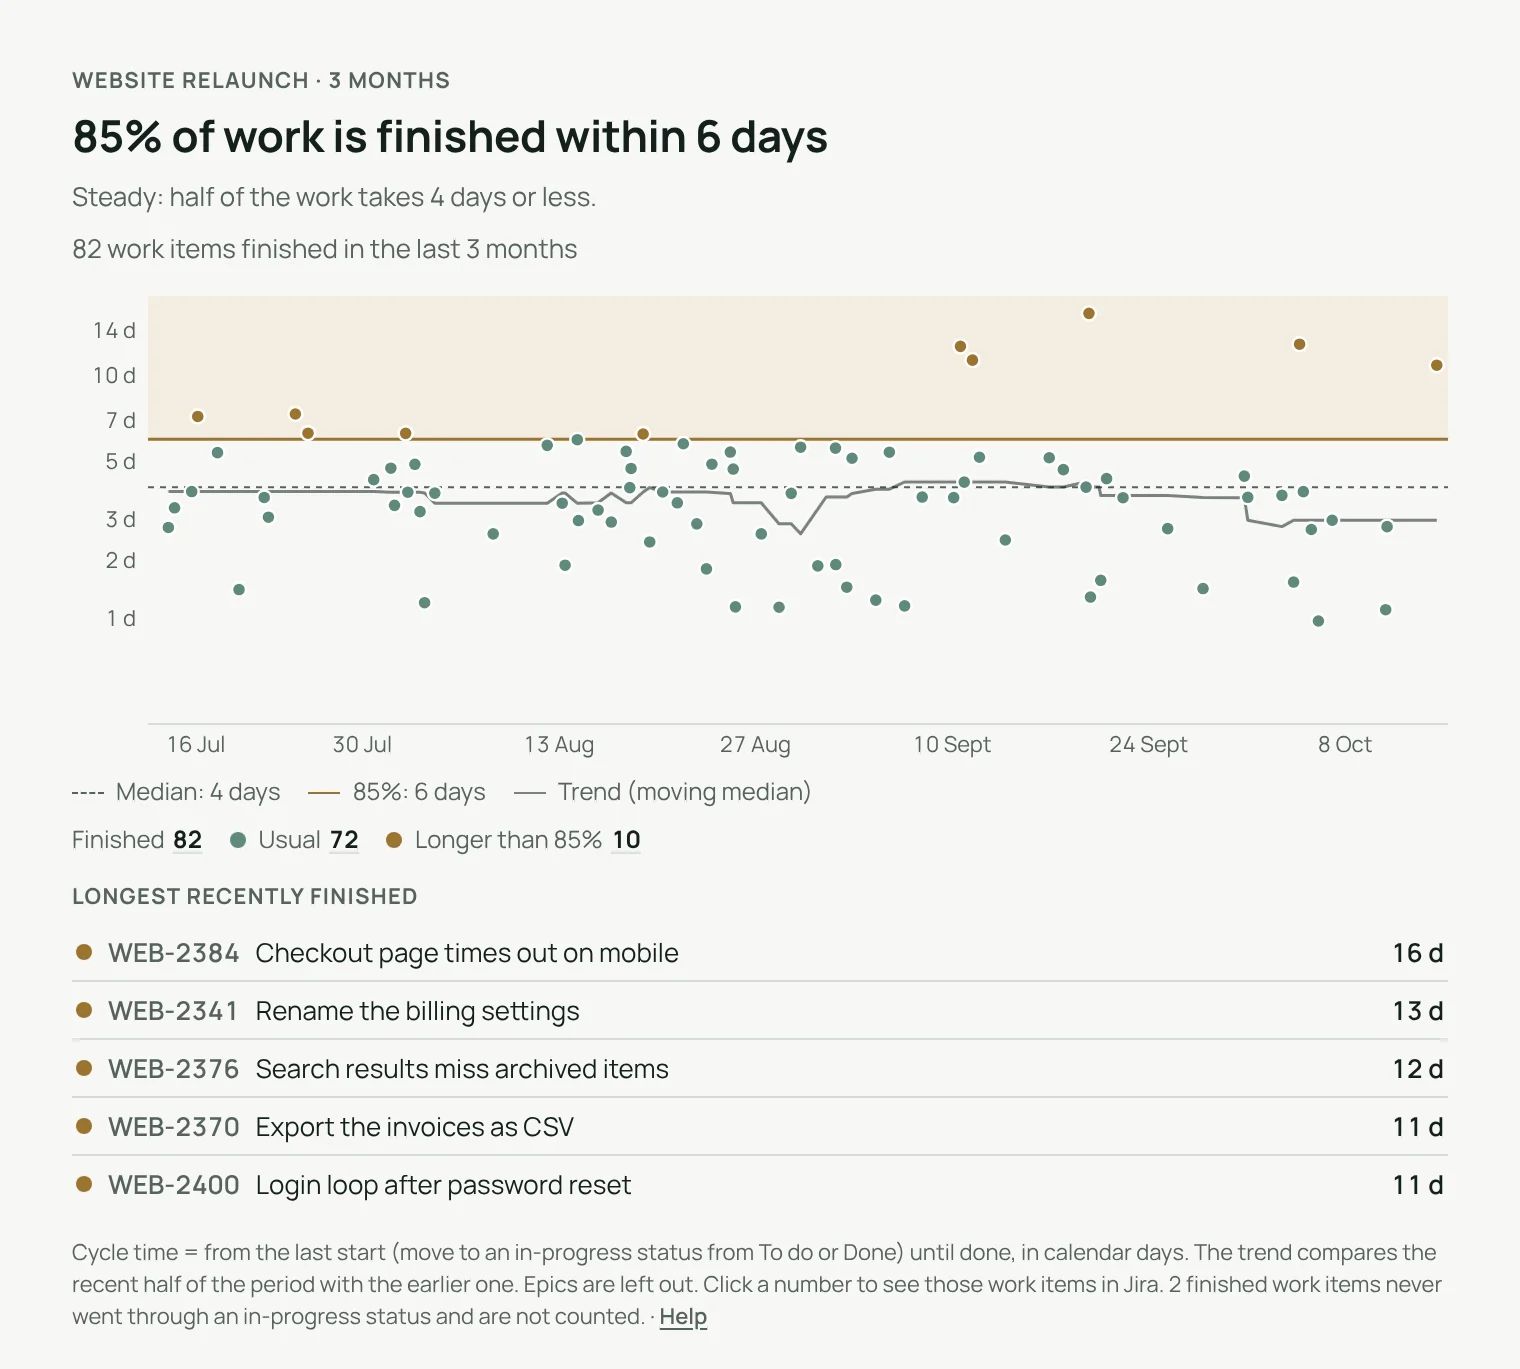
Faster or slower, in one sentence.
The recent half of the period is compared with the earlier one: faster, slower or steady, with the median of each half.
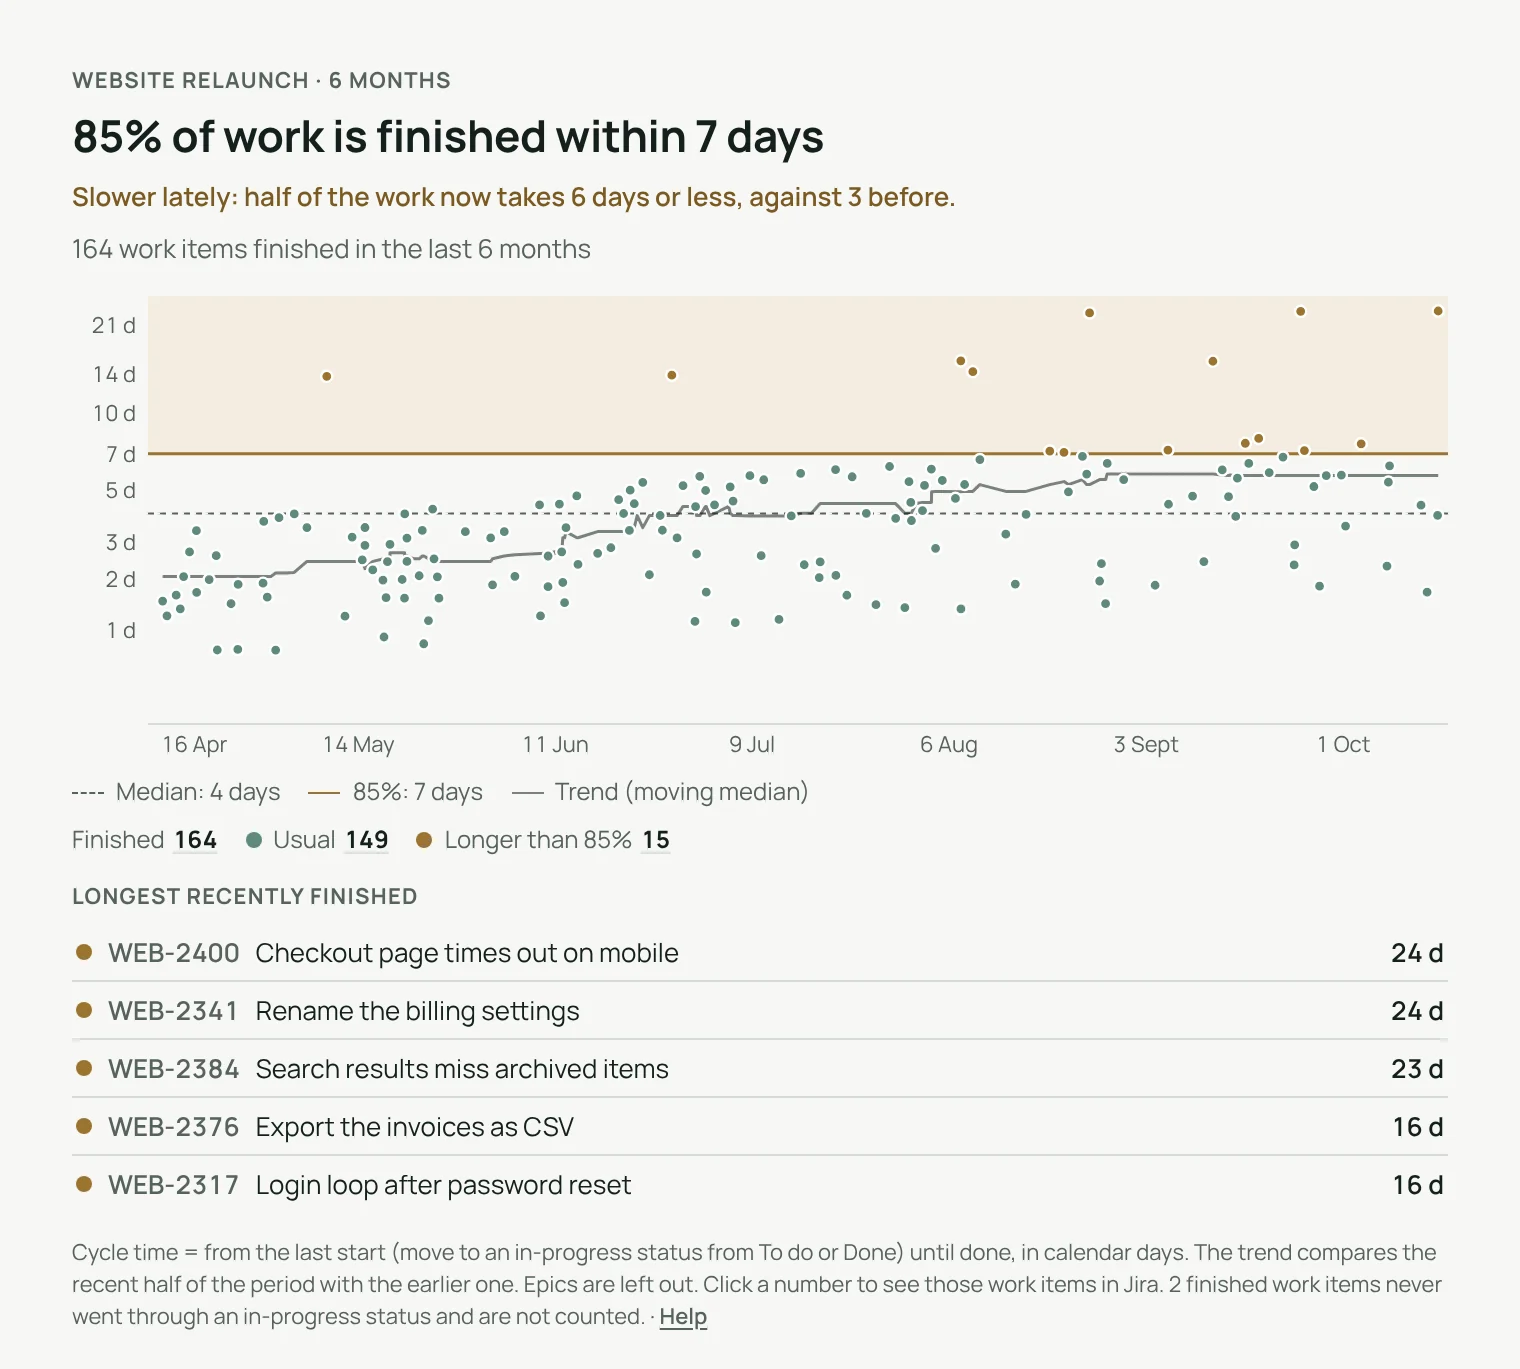
Every number can be checked.
Click a dot
Jira opens that work item.
Click a group
Finished, usual or longer than 85%: those exact work items in Jira.
Count it your way
Calendar or working days, sub-tasks if you want them.
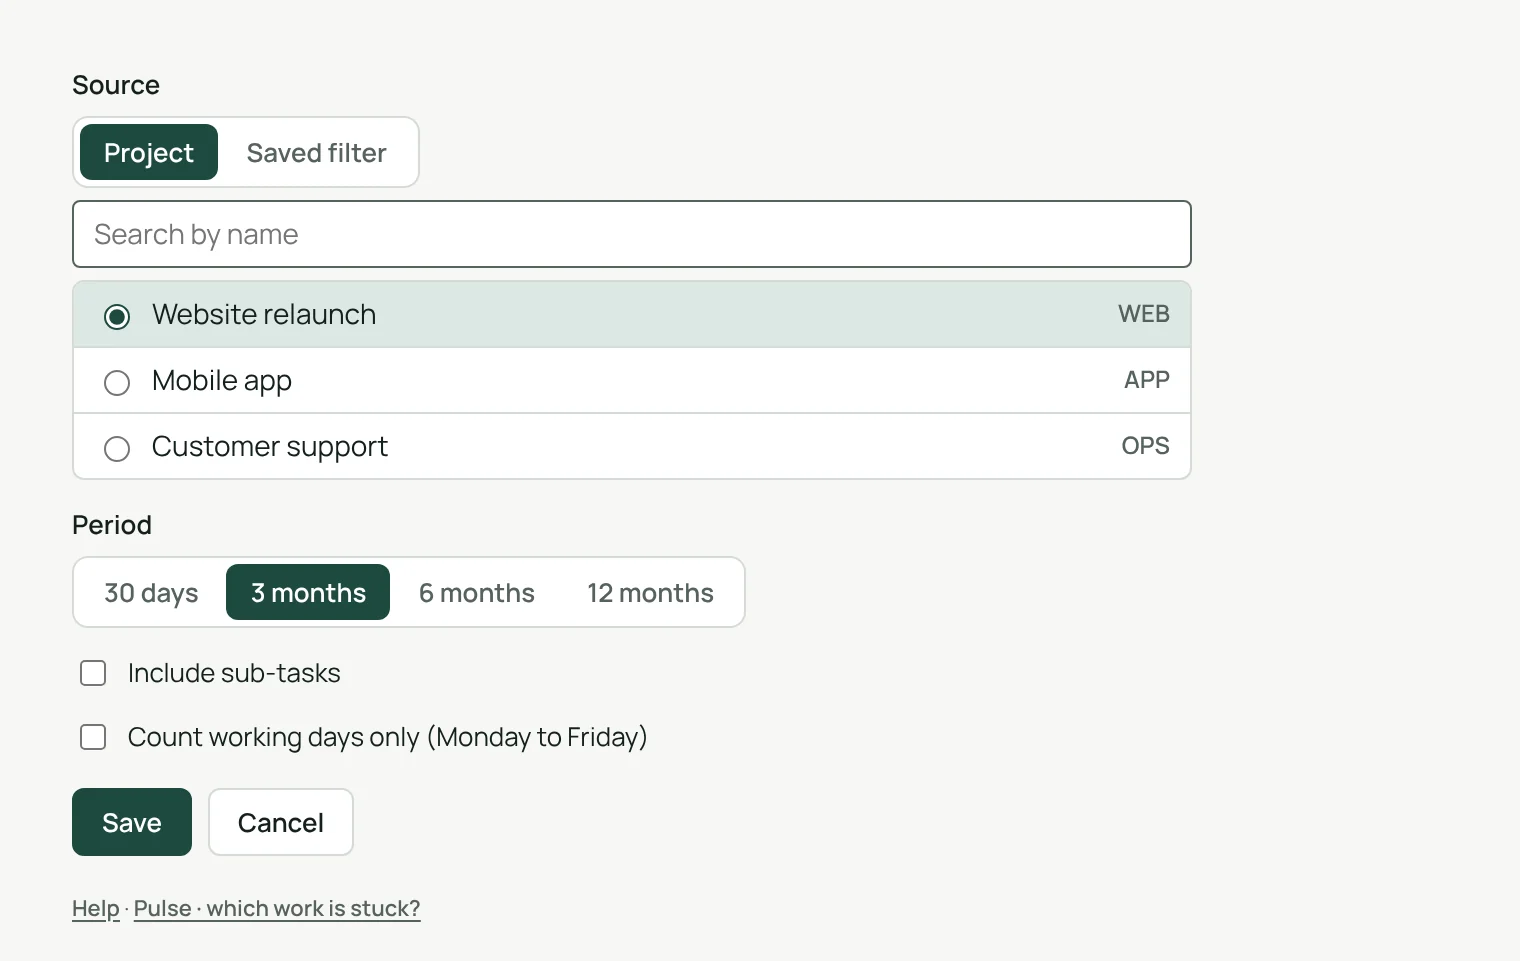
Set up in one screen.
A project or a saved filter, 30 days, 3, 6 or 12 months, sub-tasks and working days if you want them. That is all.
- Each person sees only the projects and filters they can open
- Settings are kept by Jira, with the gadget
Answer “how long will it take?” with your own numbers.
85% of your finished work took no more than a known number of days: a figure from your Jira history, not from an estimate.
Light and dark
Follows Jira’s theme.
English, French, German
Follows each person’s Jira language.
Less than 24 hours
To spare Jira, what it has just read is kept less than a day.
Runs on Atlassian
Nothing leaves your Atlassian site.
Three steps.
- Add the gadgetto any Jira dashboard.
- Pick a source and a perioda project or a saved filter, from 30 days to 12 months.
- Read the answerthe usual range and the trend, in one sentence.
Permissions and data
The gadget reads Jira with the permissions of the person viewing the dashboard: nobody sees a project or filter they cannot open. Its settings are kept by Jira with the gadget. To spare Jira, it keeps what it has just read for less than 24 hours, in Atlassian’s storage for your site: work item IDs and keys, dates, and the IDs, categories and names of statuses; for each project or filter, the status history of finished work items (dates and status IDs), given to a person only for the work items their own Jira search has just returned. No account ID, no person’s name and no work item content is kept. Nothing is sent outside your Atlassian site.
Questions, answered.
- Where do I find it?
- Edit a Jira dashboard, choose Add gadget and pick Cycle Time – Clearlane.
- What is cycle time?
- The time from the last start of a work item (a move to an in-progress status from To do or Done) until it is done.
- Which periods can it show?
- 30 days, 3, 6 or 12 months.
- What about work that never went through an in-progress status?
- It is not counted, and the chart says how many work items are left out.
- Does it work in French and German?
- Yes. The gadget follows each person’s Jira language, in English, French or German, in light and dark themes.
Clearlane dashboard gadgets
Seven charts for any Jira dashboard, each with its answer in one sentence. Every number opens its work items in Jira.
All Clearlane dashboard gadgetsBuilt and supported by Maxime Ragionieri, founder of Clearlane. Who’s behind Clearlane →
Free for up to 10 users.
Larger teams pay per user, billed by Atlassian on the Marketplace. No setup, nothing to install outside your Atlassian site. See the price for your team size →